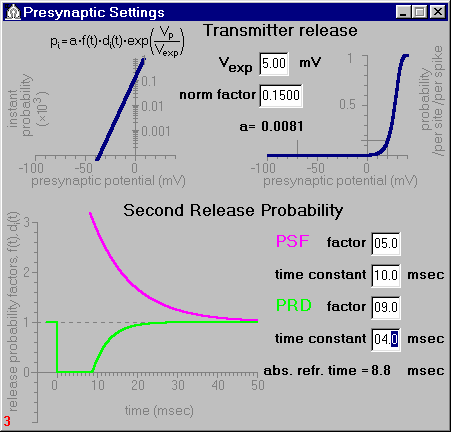
Fig.1. The Presynaptic Settings window.
As in the model eqUNO, neurotransmitter release from each site i, i = 1 ... n , was taken to be random. At each instant t, the release probability is described by the following formula:

Fig.1. The Presynaptic Settings window.
Two time-dependent factors f(t) and di(t) in the aforecited formula reflect a facilitation and depression of transmitter release following presynaptic activation. Phenomena of paired-pulse facilitation (PPF) and depression (PPD) are well known for synapses of various types. These short-term forms of synaptic plasticity are expressed in electrophysiological experiments as changes in the amplitude of a test EPSC evoked by a second presynaptic spike that follows the first (conditioning) one in the paired-pulse paradigm. The presence of PPF or PPD is dependent on types of synapses and experimental conditions and strongly varies according to the interval between the conditioning and test pulses.
In the model, initial values for both f(t) and di(t) are taken to be unit. An arrival of the presynaptic spike temporarily increases a release probability for all releasing sites. The model imitates this post-stimulus facilitation by an additional exponential term:
When transmitter release happens, release probability can temporarily decrease (post-release depression), which is imitated in the model by the factor

Results of simulation experiments performed with different models are given below in overlapping windows of Figs. 2 and 3.

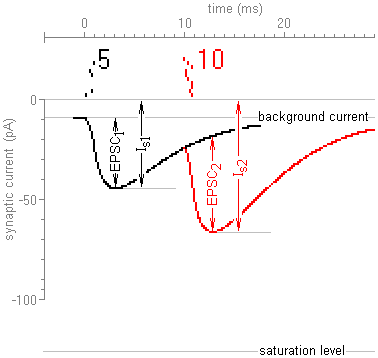
Fig.2. Numbers of quanta released (left diagrams) and EPSC amplitudes (right diagrams) in response to the first (black curves) and to the second (red curves) presynaptic spike as functions of an interstimulus interval.
In Fig.2, results of simulation for two models (with and without feedback) are shown. In the first one (back window), the ephaptic feedback was removed (Rg=0), in the second model (front window) the value of the synaptic cleft resistance was set sufficiently high to influence effectively on the synaptic transmission. The results indicate that, due to the feedback, the response to the second spike considerably increases (after the period of absolute refractoriness terminate).

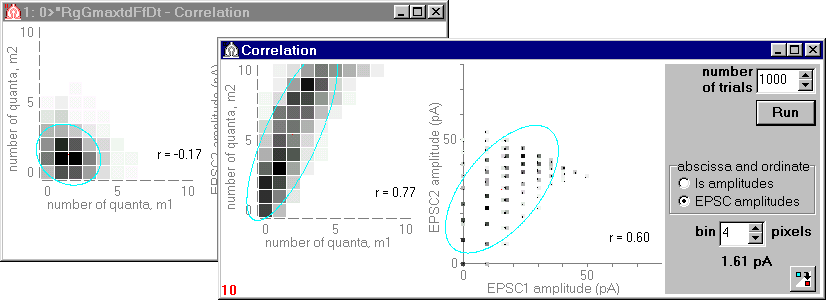
Fig.3. Correlation between responses (numbers of quanta released or EPSC amplitudes) to the first and to the second spike at small interstimulus interval. Calculated correlation coefficients, r, are shown.
Results of simulation for the model lacking the ephaptic feedback (Rg=0), shown in the back window of Fig.3, have revealed a weak inverse correlation between numbers of quanta released (due to the post-release depression). Results of simulation for the model with effective feedback are shown in the front window. In both models the post-stimulus facilitation was absent (CF=0). Nevertheless, in the second model, due to the feedback, the number of sites released to the second spike appreciably increases with growth of the response to the first spike.
Application eqDUO is available here as a self-extracting archive (compiled 22.08.2003):
Download the last version (~230K)