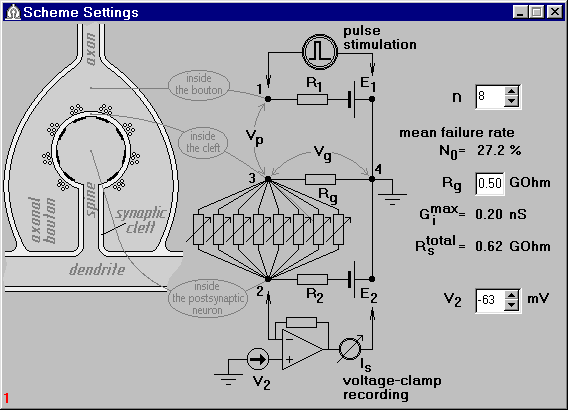
Fig.1. The Scheme Settings window.

Fig.1. The Scheme Settings window.
Simulation experiments performed on the model have described dependencies
of the strength of the feedback and therefore of the EPSC amplitude on several
synaptic parameters like number of release sites, n,
synaptic cleft resistance, Rg, release probability, etc.
 When the resistance of the synaptic cleft was set large enough,
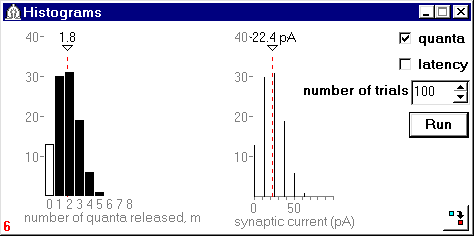
the EPSC amplitude increased (see Fig.2 and Fig.3).

Fig.2. Result of a stochatic experiment in the model without feedback (Rg= 0) displayed in the Histograms window. The mean number of quanta released and the mean EPSC value are indicated by the red dashed lines.

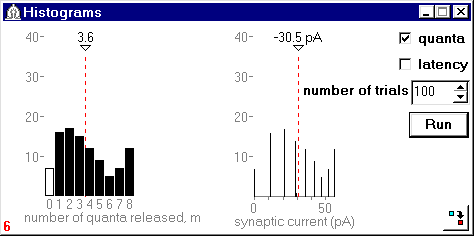
Fig.3. Result of a stochatic experiment in the model with functional feedback
(Rg= 0.50 GOhm).
Values for model parameters are indicated at the vertical panel at left. Due to the feedback
the mean number of quanta released was doubled in comparison with the case shown in Fig.2.
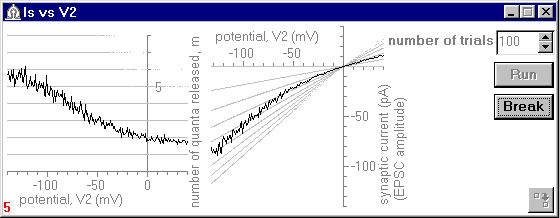
The experiments simulated several phenomena observed in physiological experiments on neocortical and hippocampal synapses in vitro6-9. For example, when the postsynaptic neuron was hyperpolarized from "normal" resting potential (e.g., from -60 mV to -90 mV) "supralinear" A-V relations appeared that were clearly distinct from the classical linear A-V curve (Fig.4).

Fig.4. An exapmle of "supralinear" A-V relation.
The same parameter values are used as in Fig.3.
Due to the positive ephaptic feedback, the mean number of quanta released
increases with hiperpolarization of the postsynaptic neuron (left panel).
As a result the A-V relation deviates from linearity (right panel).
When large enough, the positive feedback could even evoke an avalanche-like depletion of the release sites. Depolarisation of the postsynaptic neuron decreased presynaptic release so that the A-V curve showed rectification (see Fig.4). The number of response failures was shown to be dependent on the postsynaptic membrane potential level provided the baseline subsynaptic conductance was larger than zero.
Application eqUNO is available here as a self-extracting archive (compiled 22.08.2003):
Download the last version (~210K)
New features and improvements incorporated into version 1.4 of the Application eqUNO.exe include the following:
Version 1.5 of the Application eqUNO.exe was supplied with an improvement to facilitate search and activation of a necessary setting window.