
Summary. Responses of directionally selective (DS) ganglion cells of ON- or OFF-types
were recorded extracellularly from their axon terminals in the superficial layer of the tectum opticum
of immobilised fishes. When studied by the method of “paper colourimetry” (moving coloured papers
of known reflectances over coloured background under controlled ambient illumination), they proved
to be colour-blind and sensitive to far red light.
This colour-blindness was confirmed in experiments with the computer-controlled colour monitor.
Coloured stimuli moved in preferred direction over some fixed background can be divided into three
groups according to response they elicit, which in turn depends on position of stimulus colour in the
goldfish colour space: (1) stimuli that are darker than the background, i.e., that evoke responses
to their introduction into the receptive field (RF) of the OFF-type DS units or to withdrawal from the
RF of the ON-type DS units; (2) stimuli that are brighter than the background, i.e., that evoke
opposite responses; and (3) stimuli at the boundary between these areas that “match”
to the background, i.e., that do not evoke response neither to their introduction in,
nor to withdrawal from the RF, or evoke small response.
Orientation of this border permits to estimate contribution of different cone classes to spectral
sensitivity of DS units, which was found to be determined not only by red cones but by green
ones also participating weakly in opponent manner. As a result, the spectral sensitivity is reduced
in the blue-green region, its maximum being shifted even further to the red end.
There is a retinotopic projection in the tectum opticum. Axons of different cell types terminate at different depths forming layers with specific features – see Stratification of Tectal Activity for details (113K). Units selectively sensitive to contrast moving edges in proper direction are recorded in the superficial layer of the tectum. DS units fall into two main types: ON-type, sensitive to brightening, i.e., responding to introduction of stimuli brighter than background into its RF, and OFF-type, responding to introduction of darker stimuli.
Let a stimulus of some colour moves in the RF of the unit over a coloured background. By definition, the stimulus matches the background, when it does not evoke response neither to its introduction in, nor to withdrawal from the RF. If any two colours can be matched by varying only their intensities, one may conclude about the colour-blindness of the unit.
This colour matching procedure was used both as the method of “paper colourimetry”
by moving coloured papers of known reflectances over coloured background under
controlled illumination, and with the use of computer-controlled monitor.
Figure to the right displays excellent conformity of emission spectra of CRT phosphors (R, G and B)
and spectral sensitivities of goldfish cones (L, M, S). So, being specified in terms of the goldfish
colour vision, monitors proved to be very convenient tool to produce colour stimuli.
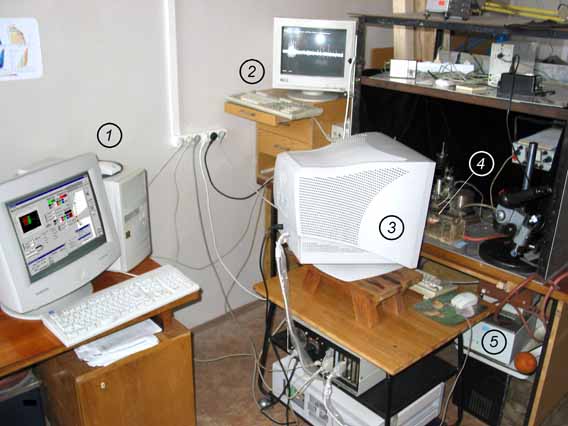
|
1, command module 2, registration module 3, stimulation module |
4, fish 5, water pump |
In experiments with the computer-controlled colour monitor this colour-blindness was confirmed at least for low colour contrasts (in the case of high colour contrast, unachievable by means of painted papers, perfect matches may fail, which suggests only “approximate” colour-blindness).
Stimuli of different colours varying in R and G values (with B = 0) were presented against the dark-red background (127, 0, 0). In this experiment 117 colours were used (of the total 65K). Their positions on RG coordinate plane are shown by circles in figure to the right, colours of the circles representing the real stimuli colours.
Stimuli were moved in optimal direction with optimal velocity (12°/sec). The spike activity was recorded in response to both introduction of a stimulus (IN) and its withdrawal out of the RF (OUT). The intensity of responses is represented in pseudo-colours similar to the geographic palette (scale below). At the top row of diagrams in Fig.R1 the results are expressed in a monitor coordinate system. At the bottom row – in coordinate plane LM of the goldfish colour space. One can see that the stimuli that are darker than the background evoked responses to their introduction into the RF, whereas the brighter ones evoked responses to their withdrawal. These areas are separated by narrow “canyon”, where both responses are rather small – the stimuli match the background.
Curvilinear shape of the “canyon” in the monitor coordinate system is explained by nonlinear relation between digital R, G and B values that control monitor input voltages and emitted energy. Being recalculated into the coordinate system of the goldfish colour space, the “canyon” acquires rectilinear appearance – see the bottom row of diagrams in Fig.R1.
In this case 96 different stimuli were presented against the same dark-red background. Contrary to OFF-type DS units, the ON-unit responded to stimuli brighter than the background introduced into the RF and to the withdrawal of the darker ones.
Both units shown in Fig.R1 and Fig.R2 possessed some weak spontaneous activity, its level is depicted in blue colour. This spontaneous activity was inhibited by introduction of stimuli that are brighter than the background in case of OFF-type unit, or by withdrawal of the darker stimuli in case of ON-type unit, what is shown by deep-blue pseudo-colour.
ACKNOWLEDGEMENTS
 This work was supported by a research grant (01-04-48632) from the Russian
Foundation for Basic Research.
This work was supported by a research grant (01-04-48632) from the Russian
Foundation for Basic Research.
Questions and comments to
Back to IITP Laboratory 8 Activity Page
Back to IITP Electronic Posters Page
Back to IITP Projects Page ( IITP russian Projects Page )
Last Update: 9 July, 2003